Troubleshooting during installation
Problems with CSP on the web based applications (webapp, team-settings, account-pages)
If you have installed wire-server, but the web application page in your browser has connection problems and throws errors in the console such as "Refused to connect to 'https://assets.example.com' because it violates the following Content Security Policies", make sure to check that you have configured the CSP_EXTRA_ environment variables.
In the file that you use as override when running helm install/update -f <override values.yaml> (using the webapp as an example):
# ... other settings...
envVars:
  # ... other environment variables ...
  CSP_EXTRA_CONNECT_SRC: "https://*.example.com, wss://*.example.com"
  CSP_EXTRA_IMG_SRC: "https://*.example.com"
  CSP_EXTRA_SCRIPT_SRC: "https://*.example.com"
  CSP_EXTRA_DEFAULT_SRC: "https://*.example.com"
  CSP_EXTRA_FONT_SRC: "https://*.example.com"
  CSP_EXTRA_FRAME_SRC: "https://*.example.com"
  CSP_EXTRA_MANIFEST_SRC: "https://*.example.com"
  CSP_EXTRA_OBJECT_SRC: "https://*.example.com"
  CSP_EXTRA_MEDIA_SRC: "https://*.example.com"
  CSP_EXTRA_PREFETCH_SRC: "https://*.example.com"
  CSP_EXTRA_STYLE_SRC: "https://*.example.com"
  CSP_EXTRA_WORKER_SRC: "https://*.example.com"
For more info, you can have a look at respective charts values files, i.e.:
Problems with ansible and python versions
If for instance the following fails:
ansible all -i hosts.ini -m shell -a "echo hello"
If your target machine only has python 3 (not python 2.7), you can tell ansible to use python 3 by default, by specifying ansible_python_interpreter:
# hosts.ini

[all]
server1 ansible_host=1.2.3.4


[all:vars]
ansible_python_interpreter=/usr/bin/python3
(python 3 may not be supported by all ansible modules yet)
Flaky issues with Cassandra (failed QUORUMs, etc.)
Cassandra is very picky about time! Ensure that NTP is properly set up on all nodes. Particularly for Cassandra DO NOT use anything else other than ntp. Here are some helpful blogs that explain why:
How can I ensure that I have correctly setup NTP on my machine(s)? Have a look at this ansible playbook
I deployed demo-smtp but I’m not receiving any verification emails
Check whether brig deployed successfully (brig pod(s) should be in state Running)
kubectl get pods -o wide
Inspect Brig logs
kubectl logs $BRING_POD_NAME
The receiving email server might refuse to accept any email sent by the
demo-smtpserver, due to not being a trusted origin. You may want to set up one of the following email verification mechanisms.
You may want to adjust the SMTP configuration for Brig (
wire-server/[values,secrets].yaml).
brig:
  config:
    smtp:
      host: 'demo-smtp'
      port: 25
      connType: 'plain'
brig:
  secrets:
    smtpPassword: dummyPassword
(Don’t forget to apply the changes with helm upgrade wire-server wire/wire-server -f values.yaml -f secrets.yaml)
I deployed demo-smtp and I want to skip email configuration and retrieve verification codes directly
If the only thing you need demo-smtp for is sending yourself verification codes to create a test account, it might be simpler and faster to just skip SMTP configuration, and simply retrieve the code internally right after it is sent, while it is in the outbound email queue.
To do this, click create a user/account/team, or if you already have, click on Resend Code:
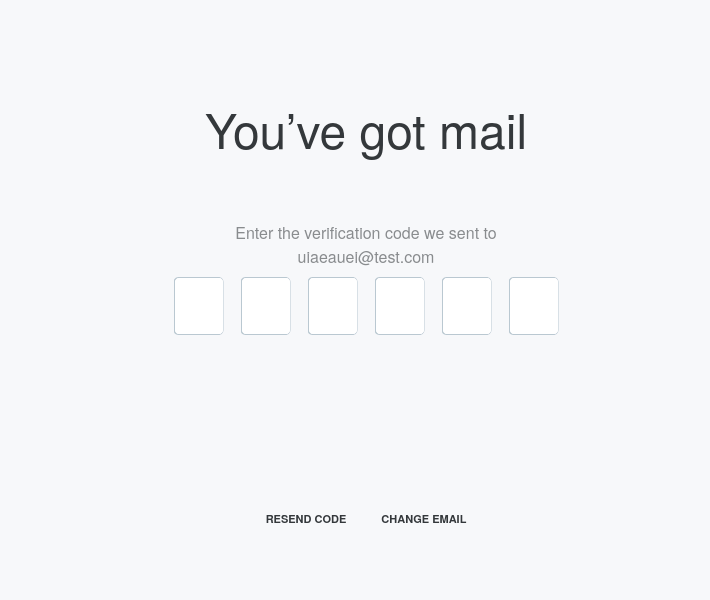
The code input interface
Then run the following command
kubectl exec $(kubectl get pod -lapp=demo-smtp | grep demo | awk '{print $1;}') -- sh -c 'cat /var/spool/exim4/input/* | grep -Po "^\\d{6}$" '
Or step by step:
Get the name of the pod
kubectl get pod -lapp=demo-smtp
Which will give you a result that looks something like this
> kubectl get pod -lapp=demo-smtp
NAME                         READY   STATUS    RESTARTS   AGE
demo-smtp-85557f6877-qxk2p   1/1     Running   0          80m
In which case, the pod name is demo-smtp-85557f6877-qxk2p, which replaces <name of pod> in the next command.
Then get the content of emails and extract the code
kubectl exec <name of pod> -- sh -c 'head -n 15 /var/spool/exim4/input/* '
Which will give you the content of sent emails, including the code
> kubectl exec demo-smtp-85557f6877-qxk2p -- sh -c 'head -n 15 /var/spool/exim4/input/*  '
==> /var/spool/exim4/input/1mECxm-000068-28-D <==
1mECxm-000068-28-D
--Y3mymuwB5Y
Content-Type: text/plain; charset=utf-8
Content-Transfer-Encoding: quoted-printable
[https://wire=2Ecom/p/img/email/logo-email-black=2Epng]
VERIFY YOUR EMAIL
myemail@gmail=2Ecom was used to register on Wire=2E Enter this code to v=
erify your email and create your account=2E
022515
This means the code is 022515, simply enter it in the interface.
If the email has already been sent out, it’s possible the queue will be empty.
If that is the case, simply click the “Resend Code” link in the interface, then quickly re-send the command, a new email should now be present.
Obtaining Brig logs, and the format of different team/user events
To obtain brig logs, simply run
kubectl logs $(kubectl get pods | grep brig | awk '{print $1;}' | head -n 1)
You will get log entries for various different types of events that happen, for example:
User creation
{"user":"24bdd52e-af33-400c-8e47-d16bf8695dbd","request":"c0575ff5a2d61bfc2be21e77260fccab","msgs":["I","Creating user"]}
Activation key creation
{"activation.code":"949721","activation.key":"p8o032Ljqhjgcea9R0AAnOeiUniGm63BrY9q_aeS1Cc=","request":"c0575ff5a2d61bfc2be21e77260fccab","msgs":["I","Activating"]}
Activation of a new user
{"user":"24bdd52e-af33-400c-8e47-d16bf8695dbd","request":"c0575ff5a2d61bfc2be21e77260fccab","msgs":["I","User activated"]}
User indexing
{"user":"24bdd52e-af33-400c-8e47-d16bf8695dbd","logger":"index.brig","msgs":["I","Indexing user"]}
Team creation
{"email_sha256":"a7ca34df62e3aa18e071e6bd4740009ce7a25278869badc1ad8f6afda792d427","team":"6ef03a2b-34b5-4b65-8d72-1e4fc7697553","user":"24bdd52e-af33-400c-8e47-d16bf8695dbd","module":"Brig.API.Public","fn":"Brig.API.Public.createUser","request":"c0575ff5a2d61bfc2be21e77260fccab","msgs":["I","Sucessfully created user"]}
Invitation sent
{"invitation_code":"hJuh1C1PzMkgtesAYZZ4SZrP5xO-xM_m","email_sha256":"eef48a690436699c653110387455a4afe93ce29febc348acd20f6605787956e6","team":"6ef03a2b-34b5-4b65-8d72-1e4fc7697553","module":"Brig.Team.API","fn":"Brig.Team.API.createInvitationPublic","request":"c43440074629d802a199464dd892cd92","msgs":["I","Succesfully created invitation"]}
Diagnosing and addressing bad network/disconnect issues
Diagnosis
If you are experiencing bad network/disconnection issues, here is how to obtain the cause from the client log files:
In the Web client, the connection state handler logs the disconnected state as reported by WebRTC as:
flow(...): connection_handler: disconnected, starting disconnect timer
On mobile, the output in the log is slightly different:
pf(...): ice connection state: Disconnected
And when the timer expires and the connection is not re-established:
ecall(...): mf_restart_handler: triggering restart due to network drop
If the attempt to reconnect then fails you will likely see the following:
ecall(...): connection timeout after 10000 milliseconds
If the connection to the SFT (Conference Calling 2.0 (aka SFT)) server is considered lost due to missing ping messages from a non-functionning or delayed data channel or a failure to receive/decrypt media you will see:
ccall(...): reconnect
Then followed by these values:
cp: received CONFPART message YES/NO
da: decrypt attempted YES/NO
ds: decrypt successful YES/NO
att: number of reconnect attempts
p: the expected ping (how many pings have not returned)
Configuration
Question: Are the connection values for bad networks/disconnect configurable on on-prem?
Answer: The values are not currently configurable, they are built into the clients at compile time, we do have a mechanism for sending calling configs to the clients but these values are not currently there.
Diagnosing issues with installation steps.
Some steps of the installation (for example helm commands) provide less feedback than others in the case errors are encountered.
These are some steps you can take to debug what is going on when the installation process breaks down.
As an example, we’ll take a case where we try installing wire-server with helm, but it fails due to cassandra being broken in some way.
This guide, while focusing on a cassandra related issue, will also provide general steps to debug problems that could be related to other components like rabbitmq, redis, etc.
Our first step is to identify and isolate which component is causing the issue.
Before installing wire-server, we run d kubectl get pods and get the result:
demo@admin-host:~/wire-server-deploy$ d kubectl get pods
NAME                            READY   STATUS    RESTARTS   AGE
demo-smtp-d98b789d7-5ntj6       1/1     Running   0          75m
fake-aws-sns-76fb45cf4f-t6mg6   2/2     Running   0          75m
fake-aws-sqs-6495cd7c98-w8f8w   2/2     Running   0          75m
rabbitmq-external-0             0/1     Pending   0          78m
reaper-84cfbf746d-wk8nc         1/1     Running   0          75m
redis-ephemeral-master-0        1/1     Running   0          76m
We then run the wire-server helm installation command:
d helm install wire-server ./charts/wire-server --timeout=15m0s --values ./values/wire-server/values.yaml --values ./values/wire-server/secrets.yaml
And we get the following error:
Error: INSTALLATION FAILED: failed pre-install: job failed: BackoffLimitExceeded
This, by itself, isn’t much help in understanding what is going wrong.
We can get more information by running d kubectl get pods again:
demo@admin-host:~/wire-server-deploy$ d kubectl get pods
NAME                            READY   STATUS    RESTARTS   AGE
cassandra-migration-qgn7r       0/1     Init:0/4  0          12s
demo-smtp-d98b789d7-5ntj6       1/1     Running   0          95m
fake-aws-sns-76fb45cf4f-t6mg6   2/2     Running   0          95m
fake-aws-sqs-6495cd7c98-w8f8w   2/2     Running   0          95m
rabbitmq-external-0             0/1     Pending   0          98m
reaper-84cfbf746d-wk8nc         1/1     Running   0          95m
redis-ephemeral-master-0        1/1     Running   0          96m
(You can also do d kubectl get pods -o wide to get more details though that’s not necessary here)
When comparing with the previous run of the command, we can see that a new pod has been created, called cassandra-migration-qgn7r, and that it is in the Init:0/4 state.
This means that the pod has been created, but that the init containers have not yet completed. In particular, it is at step 0 out of 4.
If we let it running for a while, we’d see the “RESTARTS” field increase to 1, then 2, etc, as the init containers keep failing.
We can use d kubectl logs to learn more about this failing pod:
demo@admin-host:~/wire-server-deploy$ d kubectl logs cassandra-migrations-qgn7r
Error from server (BadRequest): container "job-done" in pod "cassandra-migrations-qgn7r" is waiting to start: PodInitializing
Note the name job-done, this is the name of the last step (container) of the pod, which is not yet running.
We can get even more information about the pod by running d kubectl describe pod cassandra-migration-qgn7r:
demo@admin-host:~/wire-server-deploy$ d kubectl describe pod cassandra-migrations-qgn7r
Name:         cassandra-migrations-qgn7r
Namespace:    default
Priority:     0
Node:         kubenode1/172.16.0.129
Start Time:   Wed, 27 Sep 2023 23:03:07 +0000
Labels:       app=cassandra-migrations
              controller-uid=c43f2a66-57c8-4657-877f-36a751cf487d
              job-name=cassandra-migrations
              release=wire-server
Annotations:  cni.projectcalico.org/containerID: e314c7330c1196fbd9419267791429e3f31d6bfb910daa7739167b807116e830
              cni.projectcalico.org/podIP: 10.233.110.68/32
              cni.projectcalico.org/podIPs: 10.233.110.68/32
Status:       Pending
IP:           10.233.110.68
IPs:
  IP:           10.233.110.68
Controlled By:  Job/cassandra-migrations
Init Containers:
  gundeck-schema:
    Container ID:  containerd://1cb4a68a0877e993ed5b2ab8ccf9a18e90bf868c742141514b31fa9070be055f
    Image:         quay.io/wire/gundeck-schema:4.38.0
    Image ID:      quay.io/wire/gundeck-schema@sha256:2a060ef26b014fa43296e9bb36acd8f43070574add99821196c7da8e23127c9c
    Port:          <none>
    Host Port:     <none>
    Command:
      gundeck-schema
      --host
      cassandra-external
      --port
      9042
      --keyspace
      gundeck
      --replication-factor
      3
    State:          Running
      Started:      Wed, 27 Sep 2023 23:06:02 +0000
    Last State:     Terminated
      Reason:       Error
      Exit Code:    1
      Started:      Wed, 27 Sep 2023 23:04:19 +0000
      Finished:     Wed, 27 Sep 2023 23:05:10 +0000
    Ready:          False
    Restart Count:  4
    Environment:    <none>
    Mounts:
[...]
In this output, the «containers» are the different «stages» of this pod, described as they get executed.
We can see that the gundeck-schema container (step) has failed, and that it has been restarted 4 times.
The other containers (steps) have not yet been executed, because the previous step failed, they’ll be in a “Waiting”” state
We can get further information about the failure by running d kubectl logs cassandra-migrations-qgn7r -c gundeck-schema.
This will provide us an output such as:
demo@admin-host:~/wire-server-deploy$ d kubectl logs cassandra-migrations-qgn7r -c gundeck-schema
D, Connecting to 172.16.0.134:9042
I, Known hosts: [datacenter1:rack1:172.16.0.132:9042,datacenter1:rack1:172.16.0.133:9042,datacenter1:rack1:172.16.0.134:9042]
I, New control connection: datacenter1:rack1:172.16.0.134:9042#<socket: 11>
D, Connection established: datacenter1:rack1:172.16.0.134:9042#<socket: 12>
I, New migrations found.
I, [1] Initial schema
gundeck-schema: ResponseError {reHost = datacenter1:rack1:172.16.0.134:9042, reTrace = Nothing, reWarn = [], reCause = Unavailable {unavailMessage = "Cannot achieve consistency level ALL", unavailConsistency = All, unavailNumRequired = 3,
 unavailNumAlive = 1}}
The error message «Cannot achieve consistency level ALL» is the cause of the failure, it essentially means that some of the cassandra nodes in our cluster are not running, or not reachable in some way.
We have now succesfully reached the «root» cause of the issue.
We could use nodetool status to get more details about the cassandra nodes, ping <NODE_IP> to check if they are reachable, cat /var/log/cassandra/system.log to look for any warnings/errors, review the cassandra documentation, use diagnostic tools such as nodetool cfstats or nodetool describecluster, etc.
Note that because the cassandra-migration-qgn7r pod might get destroyed once the helm command outputs its error/terminates, you might have a limited amount of time to run these debugging commands, and might need to uninstall then re-install wire-server to get the error to occur multiple times. To uninstall the wire-server helm chart before running it again, run d helm uninstall wire-server.
More generally, you can also get d kubectl get events to get a list of all the events that have happened in your cluster, including the creation/destruction of pods, and the errors that have occured.
demo@admin-host:~/wire-server-deploy$ d kubectl get events
LAST SEEN   TYPE      REASON                    OBJECT                                           MESSAGE
17m         Normal    Scheduled                 pod/cassandra-migrations-qgn7r                   Successfully assigned default/cassandra-migrations-qgn7r to kubenode1
17m         Normal    Pulling                   pod/cassandra-migrations-qgn7r                   Pulling image "quay.io/wire/gundeck-schema:4.38.0"
17m         Normal    Pulled                    pod/cassandra-migrations-qgn7r                   Successfully pulled image "quay.io/wire/gundeck-schema:4.38.0" in 8.769605884s
14m         Normal    Created                   pod/cassandra-migrations-qgn7r                   Created container gundeck-schema
14m         Normal    Started                   pod/cassandra-migrations-qgn7r                   Started container gundeck-schema
14m         Normal    Pulled                    pod/cassandra-migrations-qgn7r                   Container image "quay.io/wire/gundeck-schema:4.38.0" already present on machine
12m         Warning   BackOff                   pod/cassandra-migrations-qgn7r                   Back-off restarting failed container
17m         Normal    SuccessfulCreate          job/cassandra-migrations                         Created pod: cassandra-migrations-qgn7r
9m25s       Normal    SuccessfulDelete          job/cassandra-migrations                         Deleted pod: cassandra-migrations-qgn7r
9m25s       Warning   BackoffLimitExceeded      job/cassandra-migrations                         Job has reached the specified backoff limit
[...]
Here we can see that the cassandra-migrations-qgn7r pod was created, then the warnings about the «BackOff» and reaching the backoff limit.
Verifying correct deployment of DNS / DNS troubleshooting.
After installation, or if you meet some functionality problems, you should check that your DNS setup is correct.
You’ll do this from either your own computer (any public computer connected to the Internet), or from the Wire backend itself.
Testing public domains.
From your own computer (not from the Wire backend), test that you can reach all sub-domains you setup during the Wire installation:
assets.<domain>teams.<domain>webapp.<domain>accounts.<domain>nginz-https.<domain>nginz-ssl.<domain>sftd.<domain>restund01.<domain>restund02.<domain>federator.<domain>
Some domains (such as the federator) might not apply to your setup. Refer to the domains you configured during installation, and act accordingly.
You can test if a domain is reachable by typing in your local terminal:
nslookup assets.yourdomain.com
If the domain is succesfully resolved, you should see something like:
Server:         127.0.0.53
Address:        127.0.0.53#53

Non-authoritative answer:
Name:   assets.yourdomain.com
Address: 388.114.97.2
And if the domain can not be resolved, it will be something like this:
Server:         127.0.0.53
Address:        127.0.0.53#53

** server can't find assets.yourdomain.com: NXDOMAIN
Do this for each and every of the domains you configured, make sure each of them is reachable from the open Internet.
If a domain can not be reached, check your DNS configuration and make sure to solve the issue.
Testing internal domain resolution.
Open a shell inside the SNS pod, and make sure you can resolve the following three domains:
minio-externalcassandra-externalelasticsearch-external
First get a list of all pods:
kubectl get pods --all-namespaces
In here, find the sns pod (usually its name contains fake-aws-sns).
Open a shell into that pod:
kubectl exec -it my-sns-pod-name -- /bin/sh
From inside the pod, you should now test each domain:
nslookup minio-external
If the domain is succesfully resolved, you should see something like:
Server:         127.0.0.53
Address:        127.0.0.53#53

Non-authoritative answer:
Name:   minio-external
Address: 173.188.1.14
And if the domain can not be resolved, it will be something like this:
Server:         127.0.0.53
Address:        127.0.0.53#53

** server can't find minio-external: NXDOMAIN
If you can not resolve any of the three domains, please request support.
Testing reachability of AWS.
First off, use the Amazon AWS documentation to determine your region code: https://docs.aws.amazon.com/AWSEC2/latest/UserGuide/using-regions-availability-zones.html
Here we will use us-west-1 but please change this to whichever value you set in your values.yaml file during installation.
First list all pods:
kubectl get pods --all-namespaces
In here, find the sns pod (usually its name contains fake-aws-sns).
Open a shell into that pod:
kubectl exec -it my-sns-pod-name -- /bin/sh
And test the reachability of the AWS services:
nslookup sqs.us-west-1.amazonaws.com
If it can be reached, you’ll see something like this:
Server:         127.0.0.53
Address:        127.0.0.53#53

Non-authoritative answer:
sqs.us-west-1.amazonaws.com     canonical name = us-west-1.queue.amazonaws.com.
Name:   us-west-1.queue.amazonaws.com
Address: 3.101.114.18
And if it can’t:
Server:         127.0.0.53
Address:        127.0.0.53#53

** server can't find sqs.us-west-1.amazonaws.com: NXDOMAIN
If you can not reach the AWS domain from the SNS pod, you need to try those from one of the servers running kubernetes (kubernetes host):
ssh kubernetes-server
Then try the same thing using nslookup.
If either of these steps fail, please request support.